I’m not surprised that some cells may have been fixed before being claimed in the spreadsheet – they could have been fixed by another task in the list or by a member of the community working in the dataset (and unaware of the spreadsheet). Such is the nature of neuroglancer…
And yes, another pass on the list of all ~40k bp cells will be run once we’re done with the current list; that way we can confirm if we’ve gotten all the cells with errors or considered “low quality”. As with any brain mapping project, the process is iterative.
And yes, if there is a particular region of interest in a dataset, an algorithm can be run to only check in those coordinates. We use(d) similar approaches in regions in the BANC/FlyWire. For this bipolar mission, we’re looking at the whole dataset.
More info on how the majority of the bipolars got found:
First, the research community manually searched for and identified bipolar cells in the entire dataset. They also took advantage of specialized synapses found in retinal bipolar cells called “ribbon synapses”. Ground truth training data for a ribbon synapse detection algorithm was created by the researchers manually finding and labeling ribbon synapses. This took quite some time and several iterations for the detection algorithm to get to an acceptable threshold of results (~90% accuracy).
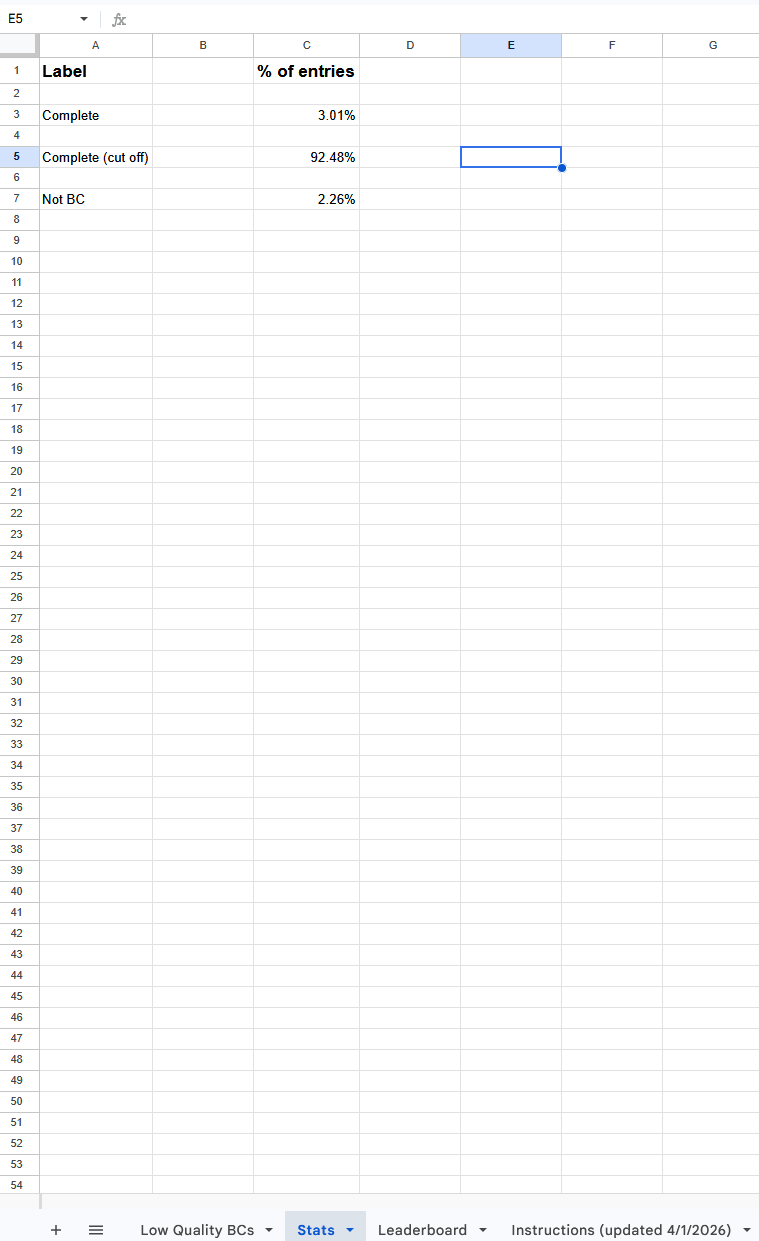
Once we had a list of bps compiled from both manual searching and the ribbon synapse detection, one of our researchers was able to create some queries for sorting the cells in the list. One query was based on the “Cell Quality” parameter I mentioned above to find cells that by comparison to other bipolar cells are “too large” (too many supervoxels or too big of a skeleton mesh) or don’t have good morphology (ie. not round enough). This helps us to focus on fixing the biggest errors in proofreading or identification.