Is it my idea, or the further down we get in the gsheet entries the more smaller and smaller branches/cells we are getting like neuroglancer ?
for me it looks like we are getting the cells one row at a time so would expect that we would get more cells with small branches at the top of the dataset and fewer again later on, just like we had a period where there was many complete cells.
1 Like
I need help in line 4625 if anyone could take a look, please.
1 Like
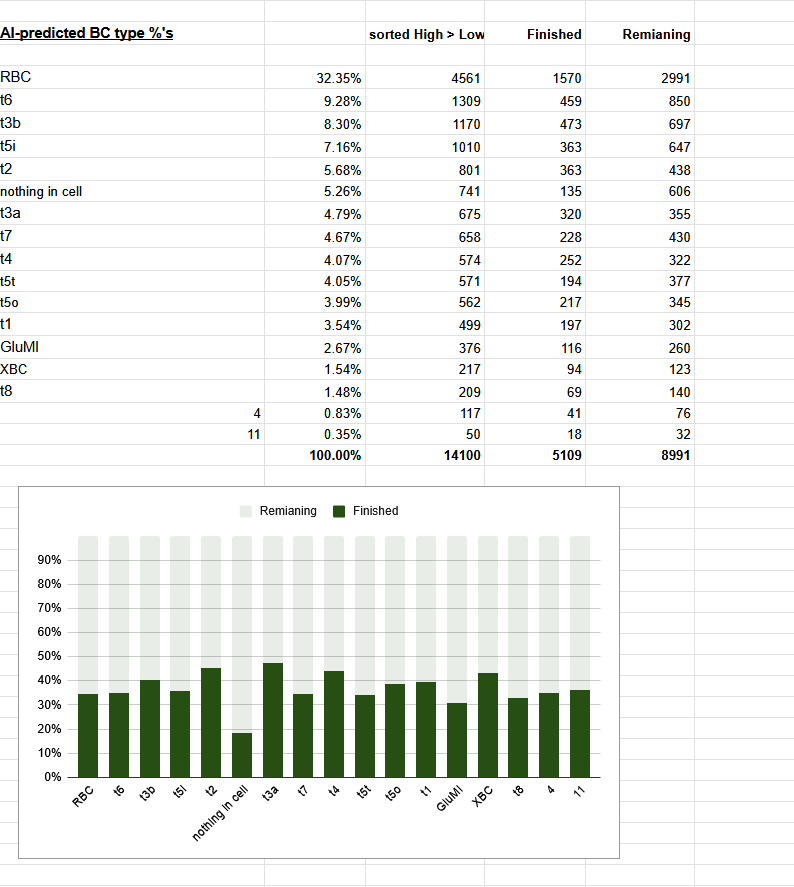
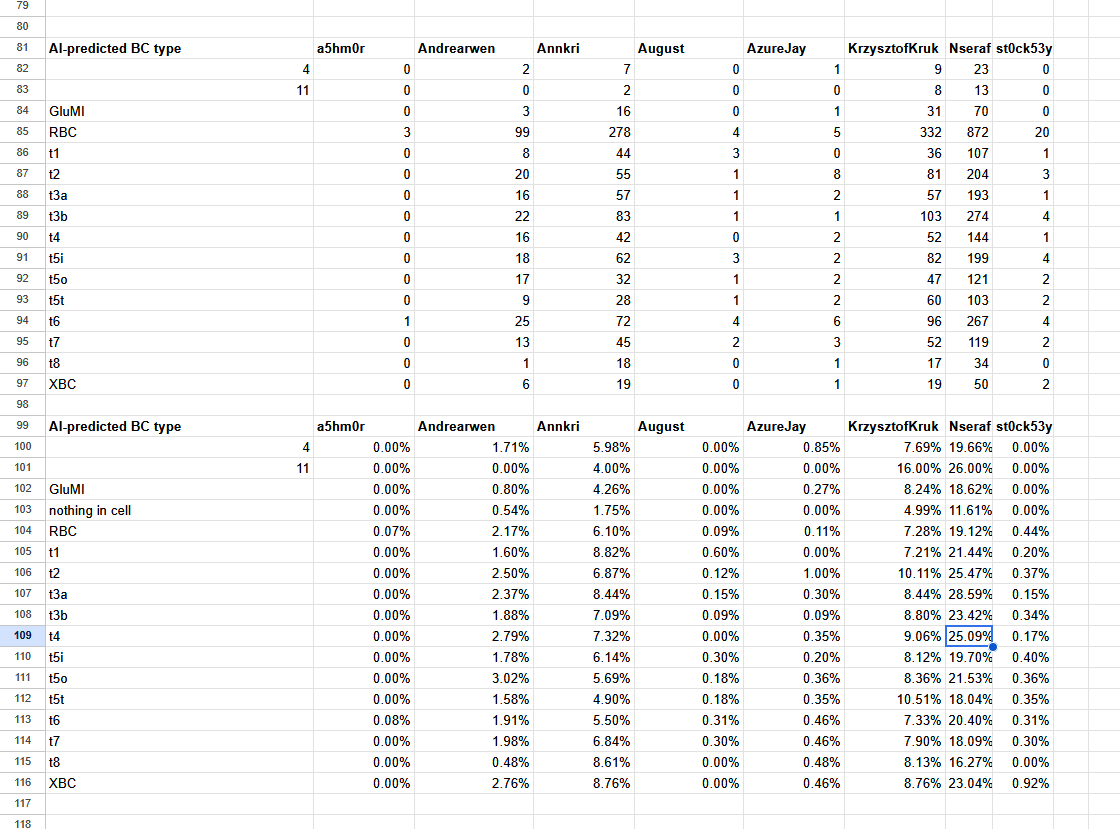
i think that mysterius type 11 is a good candidate
2 Likes
yeah but it has some entries/rows near the 10k range iirc, lol. Also, so far the 11’s I’ve proofread have all been different subtypes of extremely small branches (rest of cell EOD), so I’m not sure what ‘11’ translates to in the Database/code/auto-finder.
1 Like
tbh, I though the 4 and 11 were some random numbers or t4 and t11 (?) types with missed “t” letters and that there are more random “typos” like such xD
1 Like
lol, I’ve sorta kinda thought that since the soma coords, cells given/found and/or cell sub-type classifications are all AI/algorithm made that those 3 categories, (nothing in cell/ 4/ 11) is the AI’s/ algorithm 's way of surpassing a potential “error” ie “the cell I just found is not within my parameters, yet I think it’s a BP so therefore the sub type must be something yet I don’t know what it is so…does not compute leave empty/ 4/ 11” xD
2 Likes
Added a couple of things in the leaderboard:
- in the stats tab:
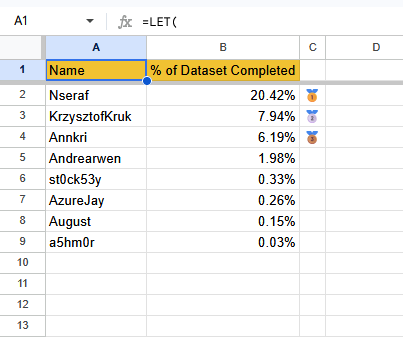
- A new tab that recreates the ‘philosophy’ of the main/admin-built Leaderboard but recreates it as a cell formula with percentages of the total dataset completed per player vs ‘simple’ numbers of how many cells each player has completed.

2 Likes
Also b/c I’m having way too much fun with it I’d like to mention…All hail our AI overlords (chatgpt) xD
2 Likes
I’ve changed the name to “% Leaderboard” to make the tab a little shorter.
1 Like
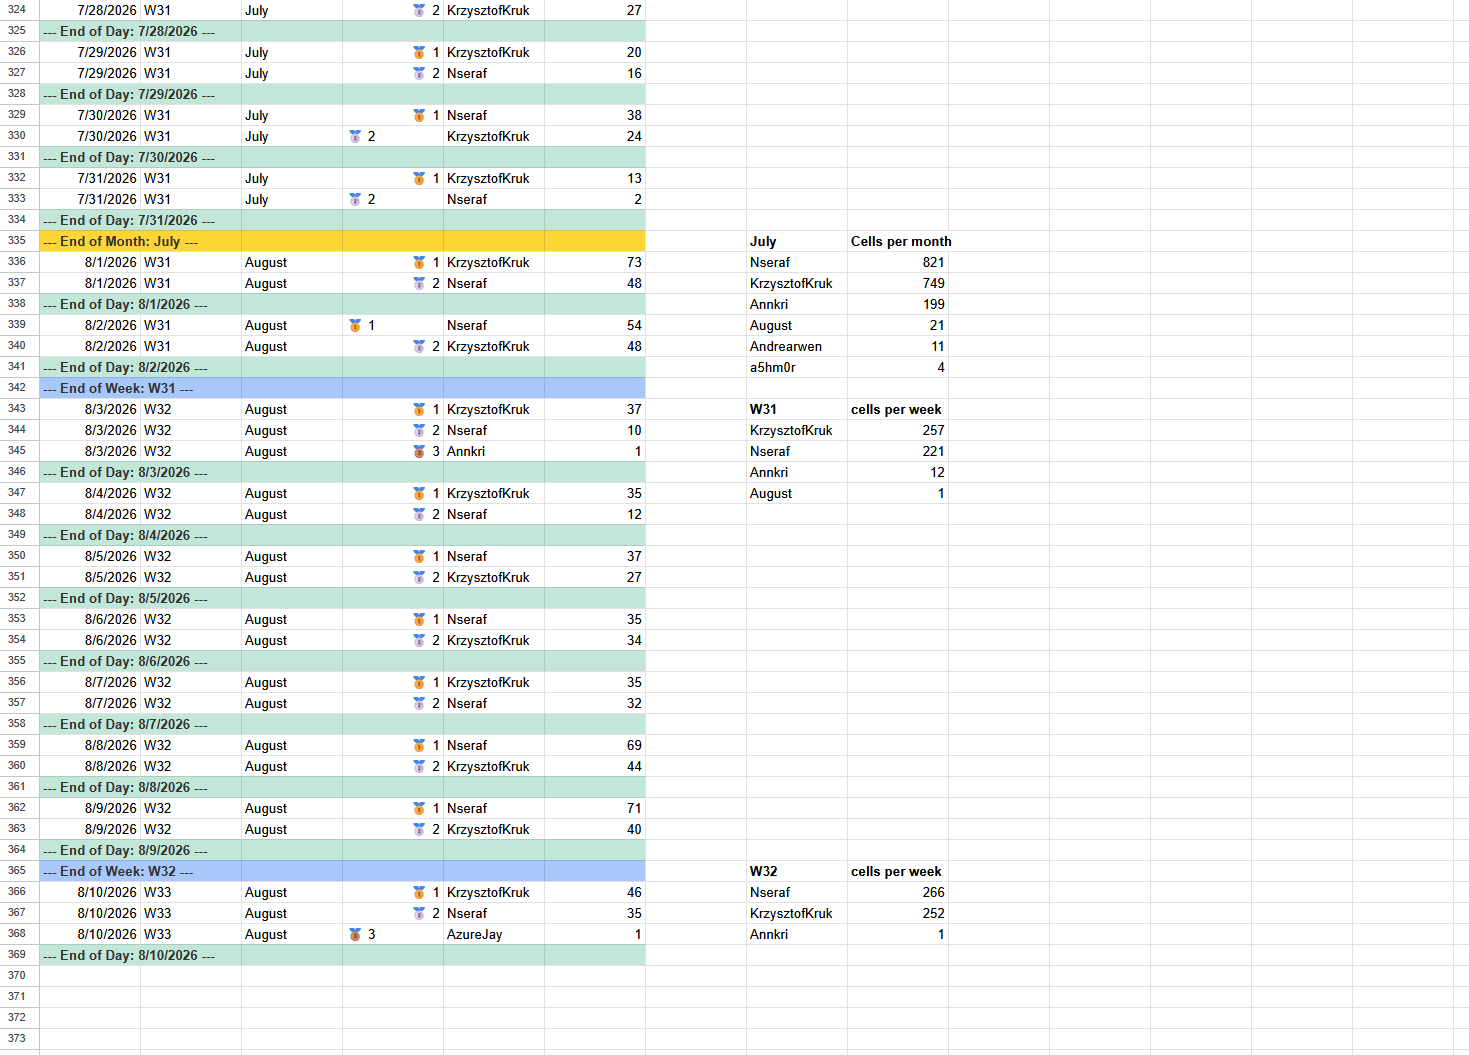
I had Chatgpt automate/include the weekly and monthly tallies in the script that calculates the Leaderboard history.
1 Like
I wonder, if it would be possible to add to the percentage leaderboard a circular graph, similar to the one in the Stats tab, but instead of weeks, show each person’s percentage and remaining cells.
1 Like
ann’s your gal for graphs. lol
1 Like
Added a graph also needed to add a entry for remaining % in the table. Hopefully this will not make trouble for getting the stats leaderboard.
2 Likes
should be ok, its a formula in cell A1.
1 Like
Don’t know, who did it, but thanks! More motivation to get as much of this pie (pizza?) as possible 
Edit: for some reason, the two previous posts didn’t display to me earlier, hence my “don’t know”. Thanks @annkri! 
2 Likes
Like we used to say back in the day…Grim’s cloak in the vent shafts. lol
2 Likes
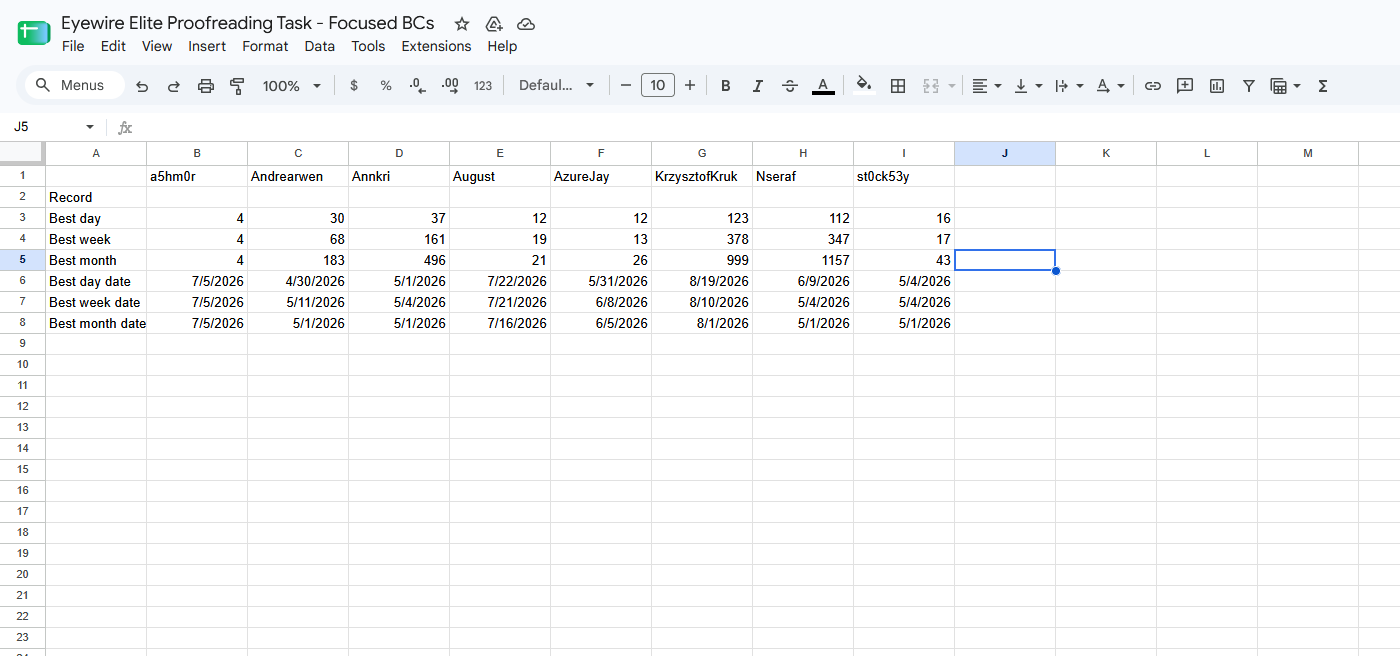
I wonder, if it would be possible to add in the Stats tab a section with various records, such as: personal best day, week, month; world best day, week, month; group best day, week, month, maybe the longest gold streak, etc.
1 Like